

Creating a Histogram in SQL Databases: MySQL, PostgreSQL, SQL Server
Learn how to create a histogram with SQL and better understand the distribution of your data.
Histograms show the frequence of values in a dataset. They are a great way to understand the distribution of your data. In this tutorial, we will show you multiple methods for creating histograms in SQL.
What is a histogram?
A histogram is a visual representation of the distribution of numeric data. Essentially it is a bar chart that shows the frequency of values in a dataset. The x-axis represents the range of values and the y-axis represents the frequency of those values.
For example - say you have a list of users and their ages, and you want to understand the distribution of ages in your dataset. A histogram would show you how many users are in each age range.
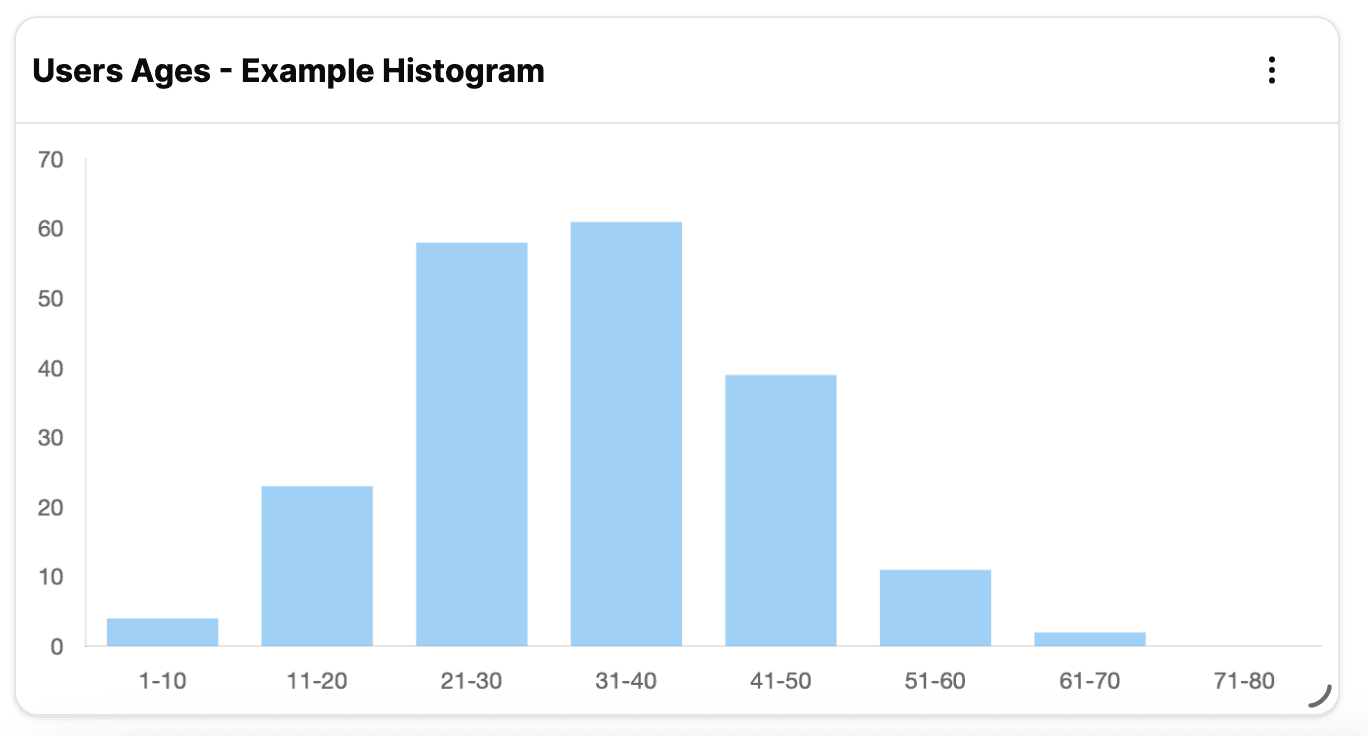
When creating a histogram, we "bin" the data into ranges. Each bin represents a range of values, and the height of the bar represents the frequency of values in that range. Thus, our goal is to count the number of values that fall into each bin. We will show you how to do this in SQL.
For this tutorial, assume we have a table called users with a column called age. We want to create a histogram of the ages of our users.
Method 1 - using the floor function
Here's what a query to create a histogram of user ages might look like:
SELECT
    floor(age / 10) * 10 as age_range_floor,
    count(*) as frequency
FROM
    users
GROUP BY
    age_range_floor
ORDER BY
    age_range_floor;
This query will yield results like this:
| age_range_floor | frequency |
|---|---|
| 0 | 4 |
| 10 | 23 |
| 20 | 58 |
| 30 | 61 |
| 40 | 39 |
| 50 | 11 |
| 60 | 2 |
What this query does it to determine the age range for each user by dividing their age by 10 and then rounding down to the nearest whole number. We then count the number of users in each age range and group the results by the age range. Finally, we order the results by the age range. Each bin is represented by the minimum value in it.
So for instance:,
- a user with an age of 25 will have their age divided by 10 (to 2.5), then floored (to 2) and then multiplied by 10 to be placed in the 20 bucket - which represents users in the 20-29 range.
- a user aged 30 will be divided by 10 (to 3), floored (to 3) and then multiplied by 10 to be placed in the 30 bucket - which represents users in the 30-39 range.
In this instance, we chose the bin size to be 10, but you can adjust the bin size to be whatever you want. For example, if you want to create a histogram with a bin size of 5, you would change the query to floor(age / 5) * 5 as age_range_floor.
You should choosed the bin size based on the distribution of your data and the insights you want to gain from the histogram (for instance, if you are trying to create a histogram of ticket prices ranging from $5 to $5,000, a bin size of 10 might be too small as youll have way to many bins, so a bin size of 250 might be more appropriate).
We can spruce up the query to make the results more readable by adding a label to the age range:
SELECT
    floor(age / 10) * 10 as age_range_floor,
    concat(age / 10) * 10, '-', (floor(age / 10) * 10 + 9) as age_range_label,
    count(*) as frequency
FROM
    users
GROUP BY
    age_range_floor
ORDER BY
    age_range_floor;
Notice how we used the concat function to create a label for the age range. We also added a + 9 to the floor(age / 10) * 10 to create the upper bound of the age range.
This query will yield results like this:
| age_range_floor | age_range_label | frequency |
|---|---|---|
| 0 | 0-9 | 4 |
| 10 | 10-19 | 23 |
| 20 | 20-29 | 58 |
| 30 | 30-39 | 61 |
| 40 | 40-49 | 39 |
| 50 | 50-59 | 11 |
| 60 | 60-69 | 2 |
Method 2 - using the width_bucket function
The second option is to use an SQL function called width_bucket. This function is used to determine the bucket number for a given value. Here's what a query to create a histogram of user ages might look like using the width_bucket function:
SELECT
    width_bucket(age, 0, 100, 10) as age_range_bucket,
    count(*) as frequency
FROM
    users
GROUP BY
    age_range_bucket
ORDER BY
    age_range_bucket;
This query will yield results like this:
| age_range_bucket | frequency |
|---|---|
| 1 | 4 |
| 2 | 23 |
| 3 | 58 |
| 4 | 61 |
| 5 | 39 |
| 6 | 11 |
| 7 | 2 |
The width_bucket function takes 4 arguments:
- the value to be binned
- the minimum value of the range
- the maximum value of the range
- the number of bins
In this case, we are creating 10 bins between 0 and 100. The width_bucket function will return the bin number for each value in the age column. We then count the number of users in each bin and group the results by the bin number. Finally, we order the results by the bin number.
With_bucket vs Floor for creating SQL Histograms
The width_bucket method is ideal when you want a specific number of bins, and the floor method is ideal when you want a specific bin size.
The main difference between the two methods is what you need to know and what you must define.
- With the
floormethod, you define the size of the bins (how big the range is) - and SQL will automatically create the number of bins needed to cover the range of values in your dataset. - With the
width_bucketmethod, you define the number of bins - and SQL will automatically create the size of the bins needed to cover the range of values in your dataset.`
Ther are also a few smaller differences between the two methods:
- With
width_bucket, the bins are numbered from 1 to the number of bins you specify, and the bins are of equal size. Withfloor, the bins are numbered from 0 to the number of bins needed to cover the range of values in your dataset, and the bins are of equal size. - With
width_bucket, you must know the minimum and maximum value in yourb dataset. This can be les flexible, but also allows you to create a histogram with a specific range of values. Withfloor, you don't need to know the minimum and maximum value in your dataset, but you can't create a histogram with a specific range of values. - With the
floormethod, empty bins will be skipped (for instance, if you have no users in the 70-79 range, the 70-79 bin will not appear in the results). With thewidth_bucketmethod, empty bins will appear in the results with a frequency of 0.
Conclusion
In this tutorial, we showed you two methods for creating histograms in SQL. The floor method is ideal when you want a specific bin size, and the width_bucket method is ideal when you want a specific number of bins. Both methods are useful for understanding the distribution of your data and gaining insights from your dataset.
Turn your SQL into Beautiful Dashboards
Create amazing KPI dashboards directly from your SQL database with Dashase
- Create charts, tables, and widgets
- Collaboration - Shared Dashboards
- AI assisted query generation - GPT-4
- Supports PostgreSQL, MySQL, SQL Server, and more
Recent Posts
Paginating data in SQL databases with OFFSET and LIMIT to manage large datasets
MySQL vs PostgreSQL: A Comparison of Two Popular Open-Source Databases
Understanding Common Table Expressions (CTEs) in PostgreSQL
The 3 types of dashboards you need for business intelligence, KPI tracking and data drive decision making
Creating a Histogram in SQL Databases: MySQL, PostgreSQL, SQL Server
Build a KPI Dashboard for your PlanetScale Database with Dashbase
Build a KPI Dashboard for your Supabase App with Dashbase
Announcing Dashbase - the AI Powered KPI Dashboard